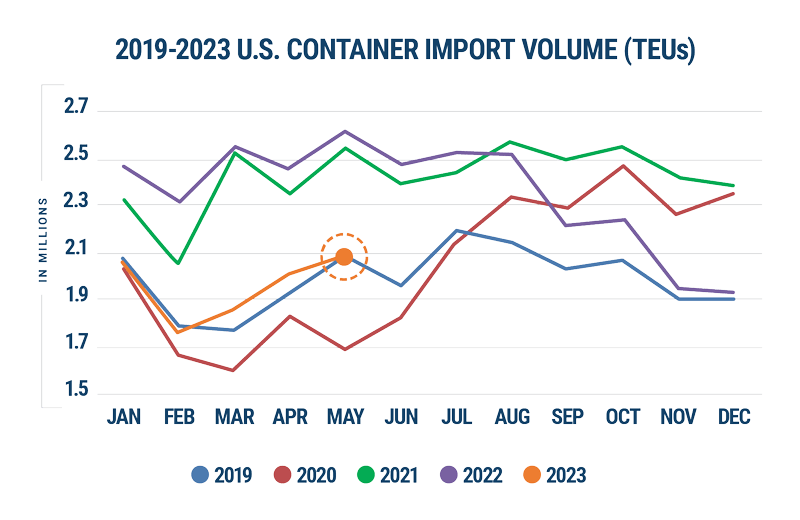
Descartes Systems Group (Nasdaq: DSGX) (TSX:DSG) has published its latest June Global Shipping Report, highlighting the ongoing trends in U.S. container imports. The report reveals that import volumes continue to closely follow 2019 levels, but remain well-below volumes seen in the first half of last year.
In May, U.S. container import volumes saw a 3.8% growth compared to April, reaching a total of 2,097,313 TEUs (twenty-foot equivalent units). The surge can be attributed to a rise in imports from China and Vietnam. However, when compared to May 2022, import volumes last month were down by 20.0%.
Despite the year-on-year decline, import volumes have remained on par with the pre-pandemic levels of 2019. Import volumes last month came in 0.5% higher than in May 2019. This trend has been consistent throughout the first four months of 2023, with import volumes showing a 1.3% difference compared to the corresponding period in 2019.

Descartes’ report highlights persistent challenges affecting global supply chain performance in 2023, including labor relations on the West Coast and increasing port delays that have returned to early 2023 levels.
“U.S. container import volumes continue to climb and closely align with 2019 levels, with support from China, Vietnam, and other South and Southeast Asian countries,” stated Chris Jones, Executive Vice President of Industry at Descartes, commented on the report. “The increase in port transit time delays and labor disputes within the International Longshore and Warehouse Union (ILWU) signify growing disruptions in the global supply chain, causing further delays in the normalization of freight volumes on the West Coast.”
Analyzing individual port performance, the Port of Los Angeles recorded the highest overall container volume increase compared to April, with an addition of 56,226 TEUs. Meanwhile, the Port of Tacoma achieved the highest percentage increase at 33.3% on a month-over-month basis.
Chinese imports showed growth for the second consecutive month in May, rising by 5.1% compared to April 2023, resulting in a total of 780,684 TEUs. However, these figures still indicate a decline of 22.2% from the peak reached in August 2022. Overall, China represented 37.2% of the total U.S. container imports in May, reflecting a 0.4% increase from April 2023.


